
Fundamentals1 min read
Gráfico de velas (candlesticks)
This text has no English version yet. You are reading the Portuguese original.
O gráfico de velas (candlesticks), também conhecido pelo acrônimo OHLC (open, high, low, close) é um gráfico que apresenta velas que indicam os preços de abertura, máximo, mínimo e fechamento de um valor mobiliário.
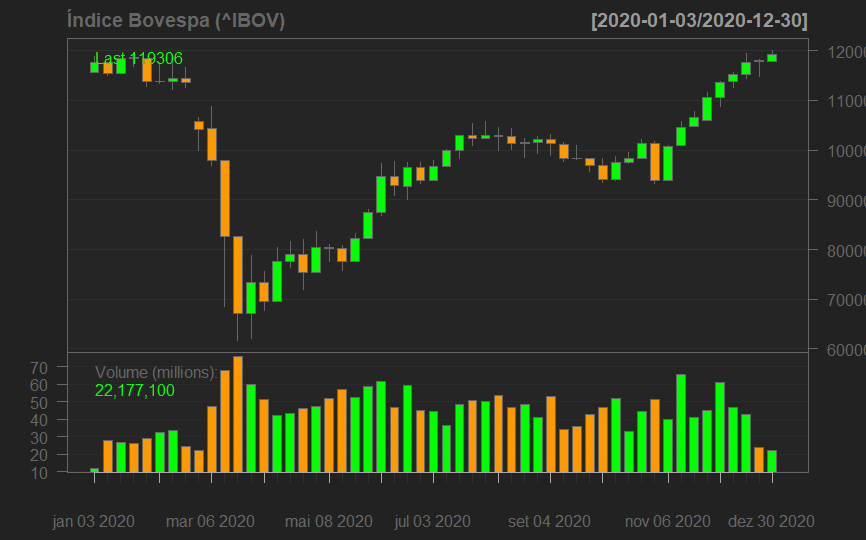
O código abaixo apresenta o código R utilizado para a elaboração do gráfico acima apresentado.
# Código R
# Gráfico de velas

library(quantmod)
library(TTR)

options(digits=5)

#Periodo de Analise
startDate <- as.Date("2020-01-01")
endDate   <- as.Date("2020-12-31")

getSymbols("^BVSP", src = "yahoo", from = startDate, to = endDate)
BVSP <- na.omit(BVSP)

BVSP <- to.weekly(BVSP)[, -6]

ohlc<-as.quantmod.OHLC(BVSP, col.names=c("Open","High","Low","Close","Volume"))

chartSeries(ohlc, name="Índice Bovespa (^IBOV)")